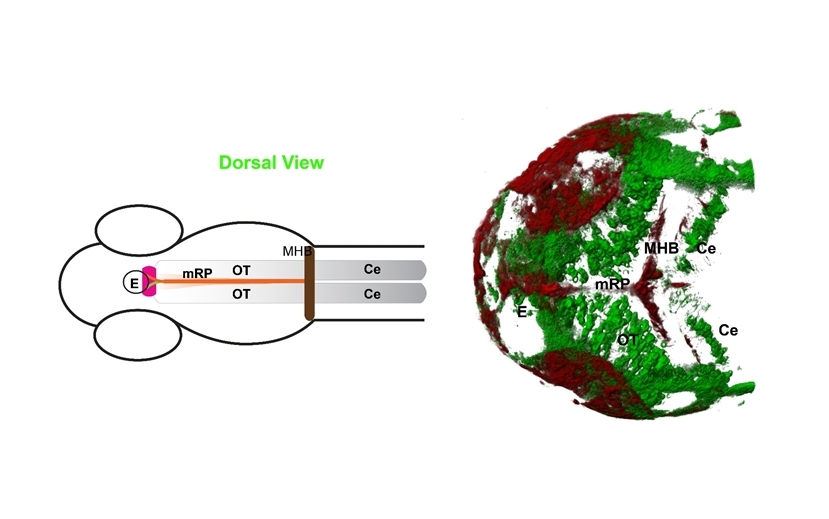
A research team led by Prof Thorsten WOHLAND from the Department of Biological Sciences and the Department of Chemistry, NUS has used imaging and quantitative fluorescence techniques to address how Wnt3, a member of the Wnt family, spreads in the developing zebrafish brain to achieve long-range signalling (see Figure). First, the team showed that Wnt3 tagged with enhanced green fluorescent protein (Wnt3EGFP) under the control of Wnt3 regulatory sequences spreads a considerable distance from the cells that produced it. Subsequently, the team used two characterisation techniques, fluorescence correlation spectroscopy (FCS) and fluorescence recovery after photo bleaching (FRAP) to measure the mobility of Wnt3EGFP at different length scales. FCS is an analytical technique that measures the diffusion of fluorescent molecules by monitoring the fluctuations in fluorescence intensity emitted by the molecules in a small observation volume (femtolitre scale) whereas FRAP measures the recovery of the fluorescence intensity in an irreversibly photo bleached region (micrometre scale). The team showed that the local mobility of Wnt3, as measured by FCS, is much larger than the long-range mobility, as measured by FRAP. They then demonstrated that this discrepancy is fully explained by Wnt3EGFP interactions with proteins present in the extracellular matrix and receptor, and co-receptor binding. This strongly reduces Wnt3’s long-range mobility in the zebrafish brain. Collectively, the team’s findings set the framework for future quantitative investigation of the Wnt3 interaction network during mammalian brain development. Prof Wohland said, “Our capability to quantitatively measure molecular interactions and dynamics within small living organisms provides new insights into the processes that govern development at the molecular level.”
The figure above shows Wnt3 source and target regions: (A) Schematic illustration of the zebrafish brain at 48 hours post fertilisation (hpf). (B) 3D projection of the source (red) and target (green) regions of the zebrafish brain at 48 hpf. (E – epithalamus; Ce – cerebellum; MHB – midbrain hindbrain boundary; mRP- midbrain roof plate; OT – optic tectum) [Credit: eLife]. Read more on their discovery here.
